Infographics Presentation templates
Discover our engaging Google Slides and PowerPoint slides full of infographics to present your information or data clearly and quickly!
Filter by
Filters
It seems that you like this template!
Process Diagrams
If you want to present the progress of your sales, project plan or manufacturing activities, process diagrams will be your best friends. They have the ability to develop a clear description of a process, step by step. They are pretty useful to achieve better communication with other people involved in...
Career Day for Elementary Students Infographics
Download the Career Day for Elementary Students Infographics template for PowerPoint or Google Slides and discover the power of infographics. An infographic resource gives you the ability to showcase your content in a more visual way, which will make it easier for your audience to understand your topic. Slidesgo infographics...
Project Schedule - Gantt Charts Infographics
The ultimate collection of Gantt charts for projects has arrived! Slidesgo has designed thirty different layouts with this kind of chart, ideal for representing the duration of tasks or activities. Great for keeping track of deadlines at a glance, adapt these designs to your needs and match the colors to...
Company Closing Ceremony Meeting Infographics
Download the Company Closing Ceremony Meeting Infographics template for PowerPoint or Google Slides and discover the power of infographics. An infographic resource gives you the ability to showcase your content in a more visual way, which will make it easier for your audience to understand your topic. Slidesgo infographics like...
Women Infographics
Download the "Women Infographics" template for PowerPoint or Google Slides and discover the power of infographics. An infographic resource gives you the ability to showcase your content in a more visual way, which will make it easier for your audience to understand your topic. Slidesgo infographics like this set here...
Strategic Product Roadmap
Sometimes, one of our designers thinks of something in a more literal way and then reflects it in a template... But we say that's a good chance of impressing the audience with an unexpected creation! Product roadmaps are like the strategic direction chosen for your product—the path your company will...
Co-operative Company Business Plan Infographics
Download the Co-operative Company Business Plan Infographics template for PowerPoint or Google Slides and discover the power of infographics. An infographic resource gives you the ability to showcase your content in a more visual way, which will make it easier for your audience to understand your topic. Slidesgo infographics like...
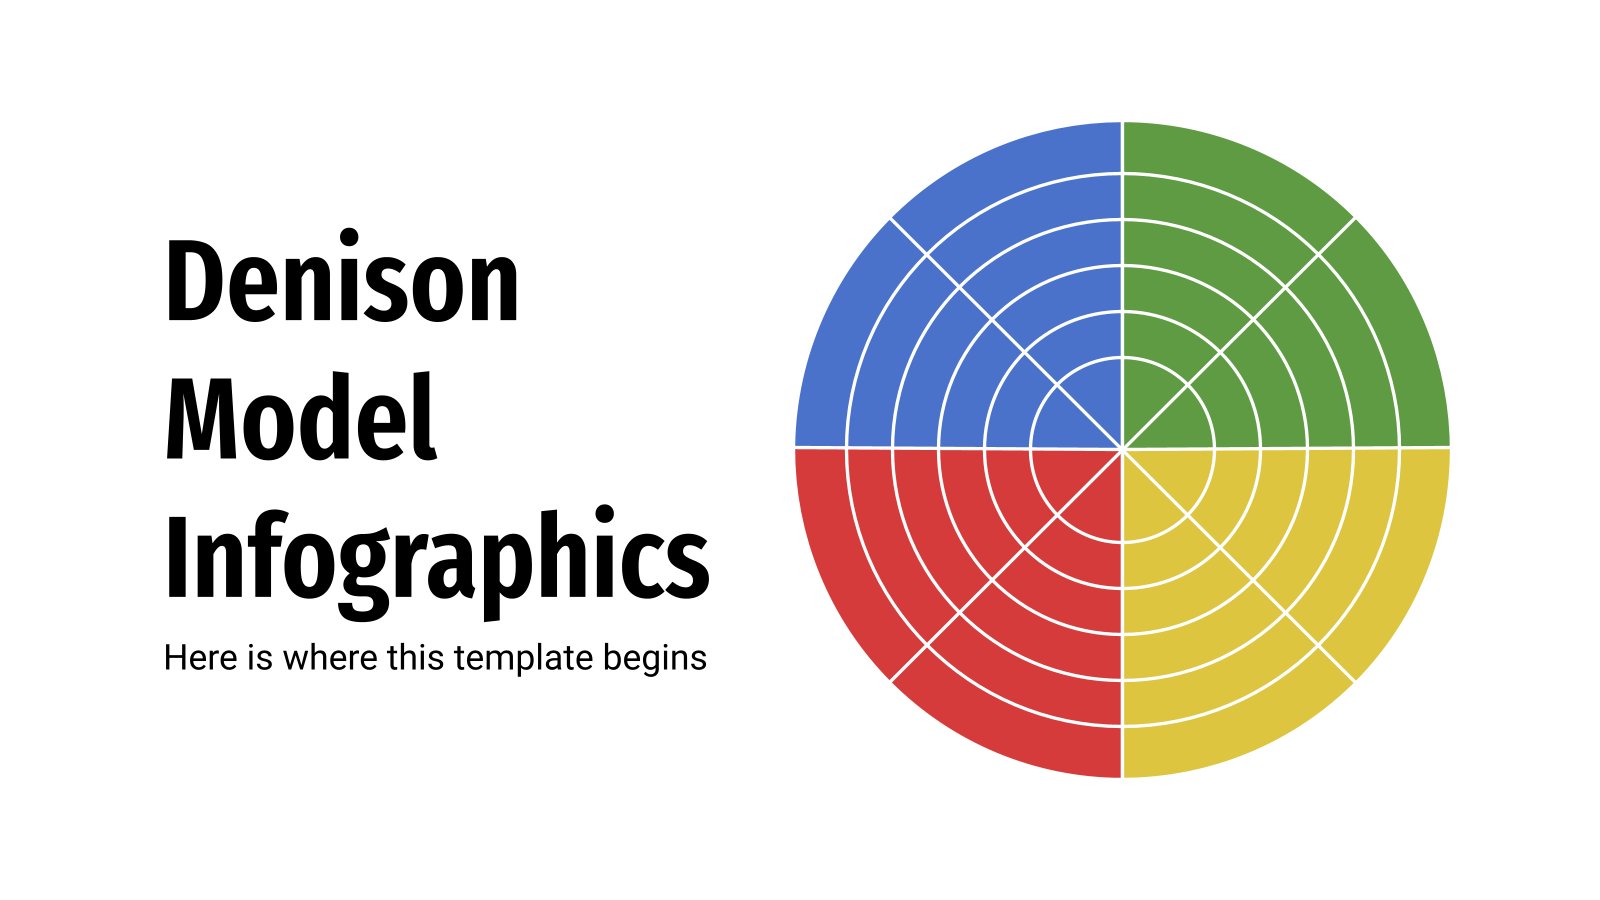
Denison Model Infographics
The Denison model is based on the research of Dr. Daniel Denison, who related organizational culture to certain business performance indicators. Both must be aligned to achieve business objectives. This template includes dozens of graphs and flat style infographics related to this model, which analyzes four key company factors: adaptability,...
Professional Business Strategy Infographic
Download the "Professional Business Strategy Infographic" template for PowerPoint or Google Slides to get the most out of infographics. Whether you want to organize your business budget in a table or schematically analyze your sales over the past year, this set of infographic resources will be of great help. Start...
Home Economics Class for Middle School Infographics
Download the Home Economics Class for Middle School Infographics template for PowerPoint or Google Slides and discover the power of infographics. An infographic resource gives you the ability to showcase your content in a more visual way, which will make it easier for your audience to understand your topic. Slidesgo...
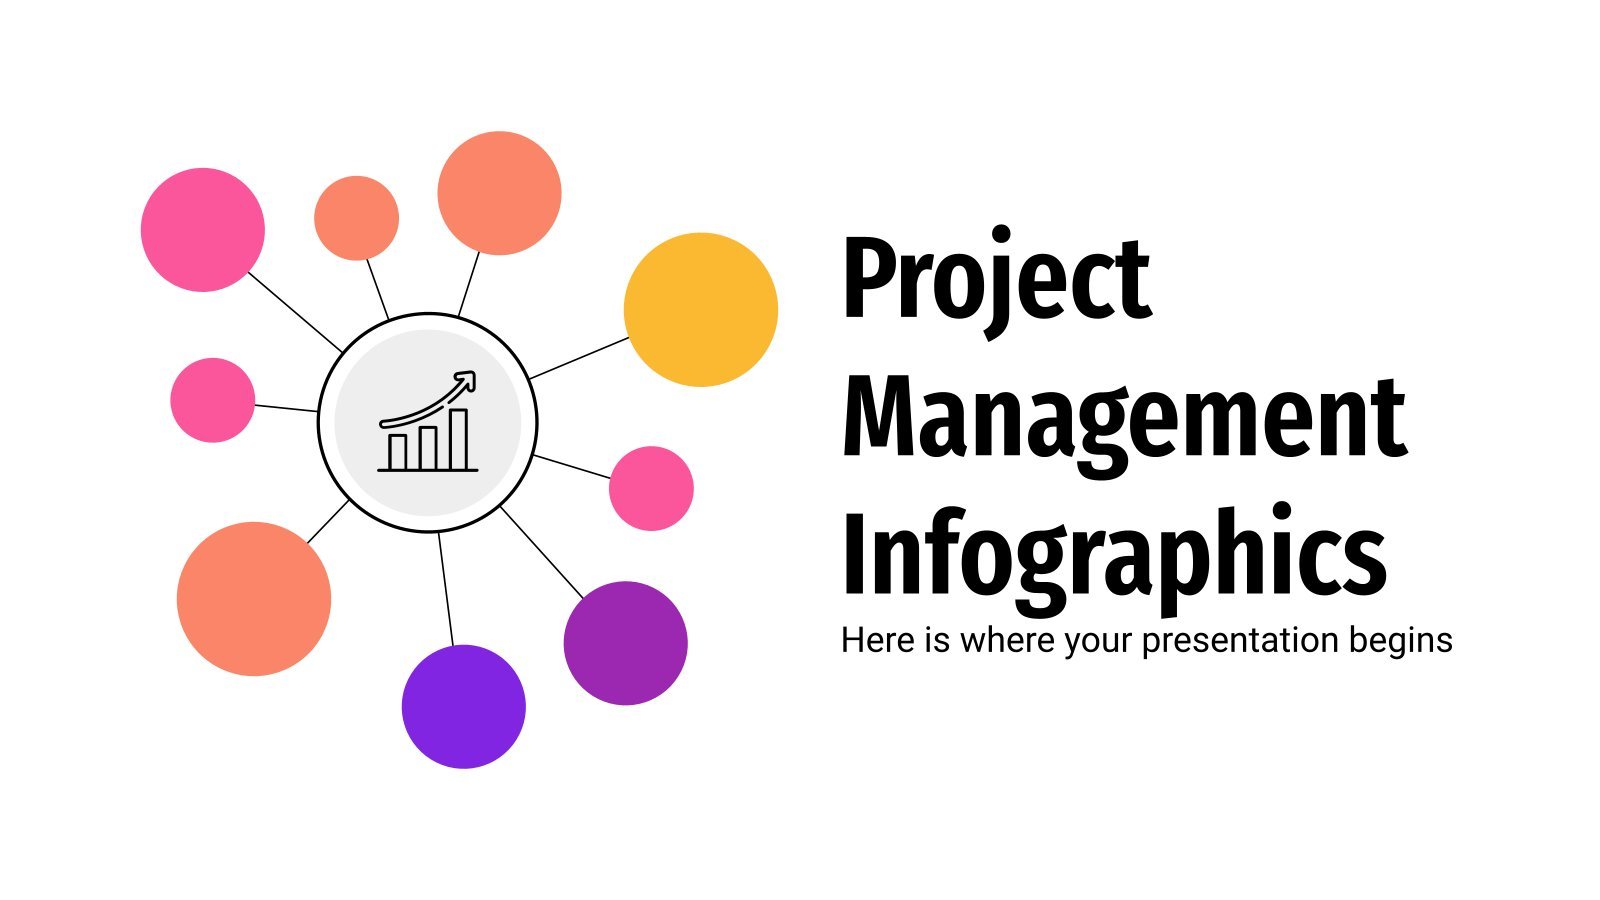
Project Management Infographics
Do you want to present your business or company data in an effective way? Go ahead and use these Project Management Infographics. They contain a lot of different designs: circular, arrows, paths… We have created them using yellow, orange, pink and purple hues and plenty of icons that you can...
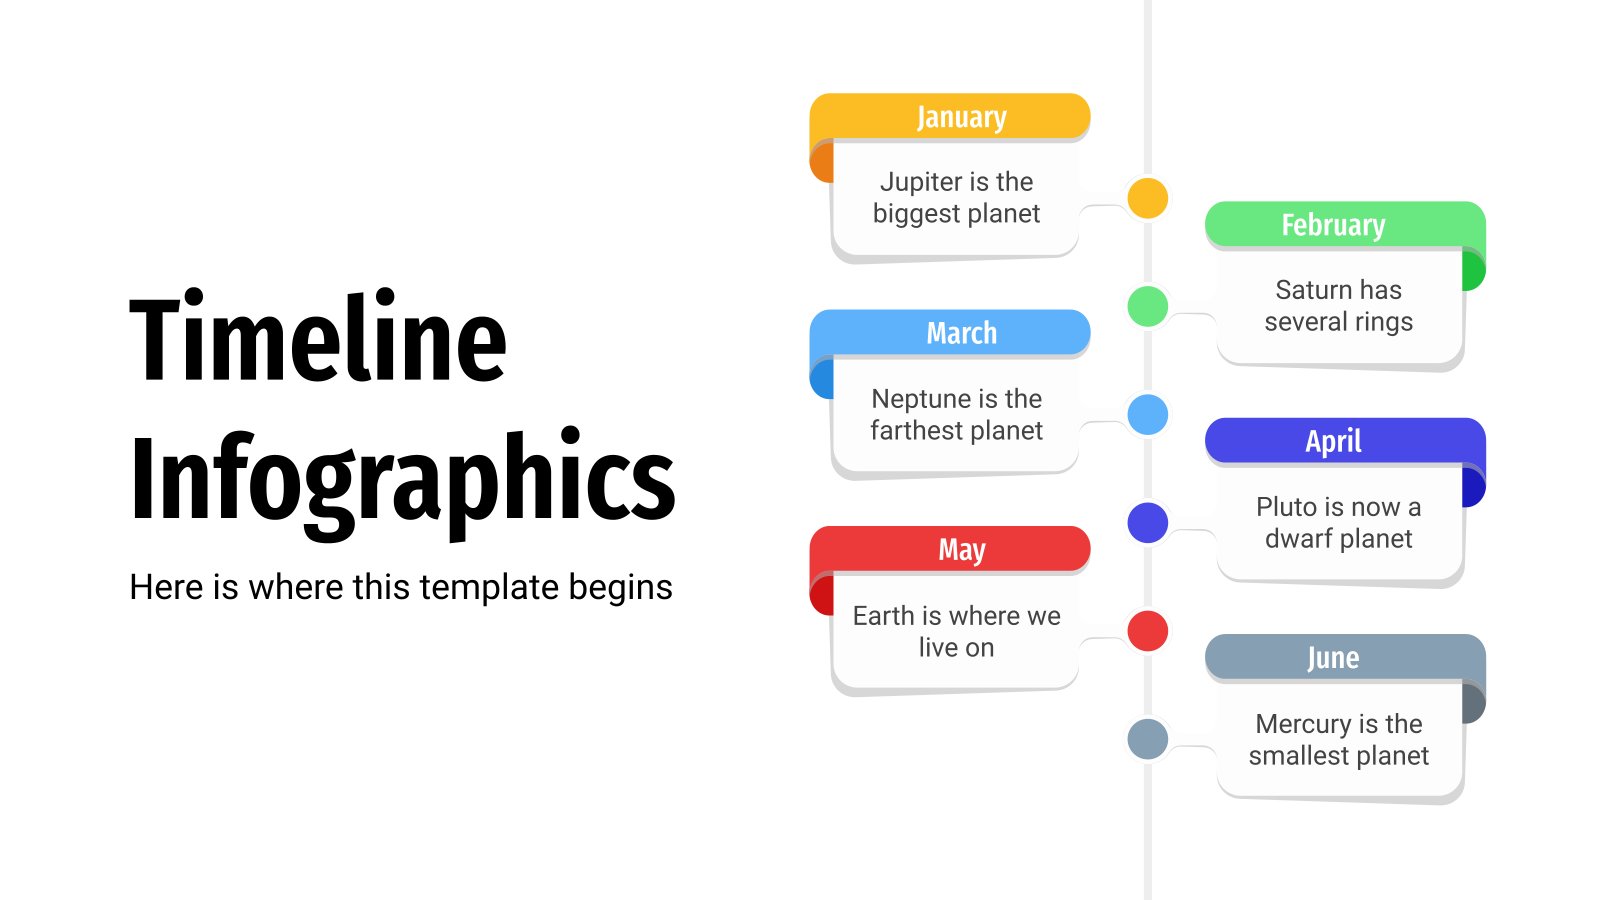
Timeline Infographics
Timeline infographics are simply great if you need to create a list of events, steps or processes in chronological order or if you want to mark some milestones! Never miss a key action, a date or a deadline again! They are very visual, clear to follow and logical.
Resume for Everyone Infographics
Download the Resume for Everyone Infographics template for PowerPoint or Google Slides and discover the power of infographics. An infographic resource gives you the ability to showcase your content in a more visual way, which will make it easier for your audience to understand your topic. Slidesgo infographics like this...
Biochemical Technician CV Infographics
Download the Biochemical Technician CV Infographics template for PowerPoint or Google Slides and discover the power of infographics. An infographic resource gives you the ability to showcase your content in a more visual way, which will make it easier for your audience to understand your topic. Slidesgo infographics like this...
Graph Paper Style Thesis
Are you familiar with graph paper? Don't you know what it is? We're sure you do, you just didn't know its name. It's paper with a grid, facilitating the representation of graphs or other math-related things. Speaking of which, is your thesis about mathematics? Or maybe not but you just...
Strategic Roadmap Infographics
How far can your company go? We know that for you there are no limits and that your company is capable of surpassing everything it decides to do. This is great, but to organize all the goals you want to achieve, designing a strategic roadmap will be a great idea...
Design Elements Infographics
This new set of infographics is a jack of all trades. We have created different designs, not tied to a specific topic or purpose, which means they're suitable for the majority of the uses you might come up with. From timelines to graphs, from percentage bars to pie charts. Various...
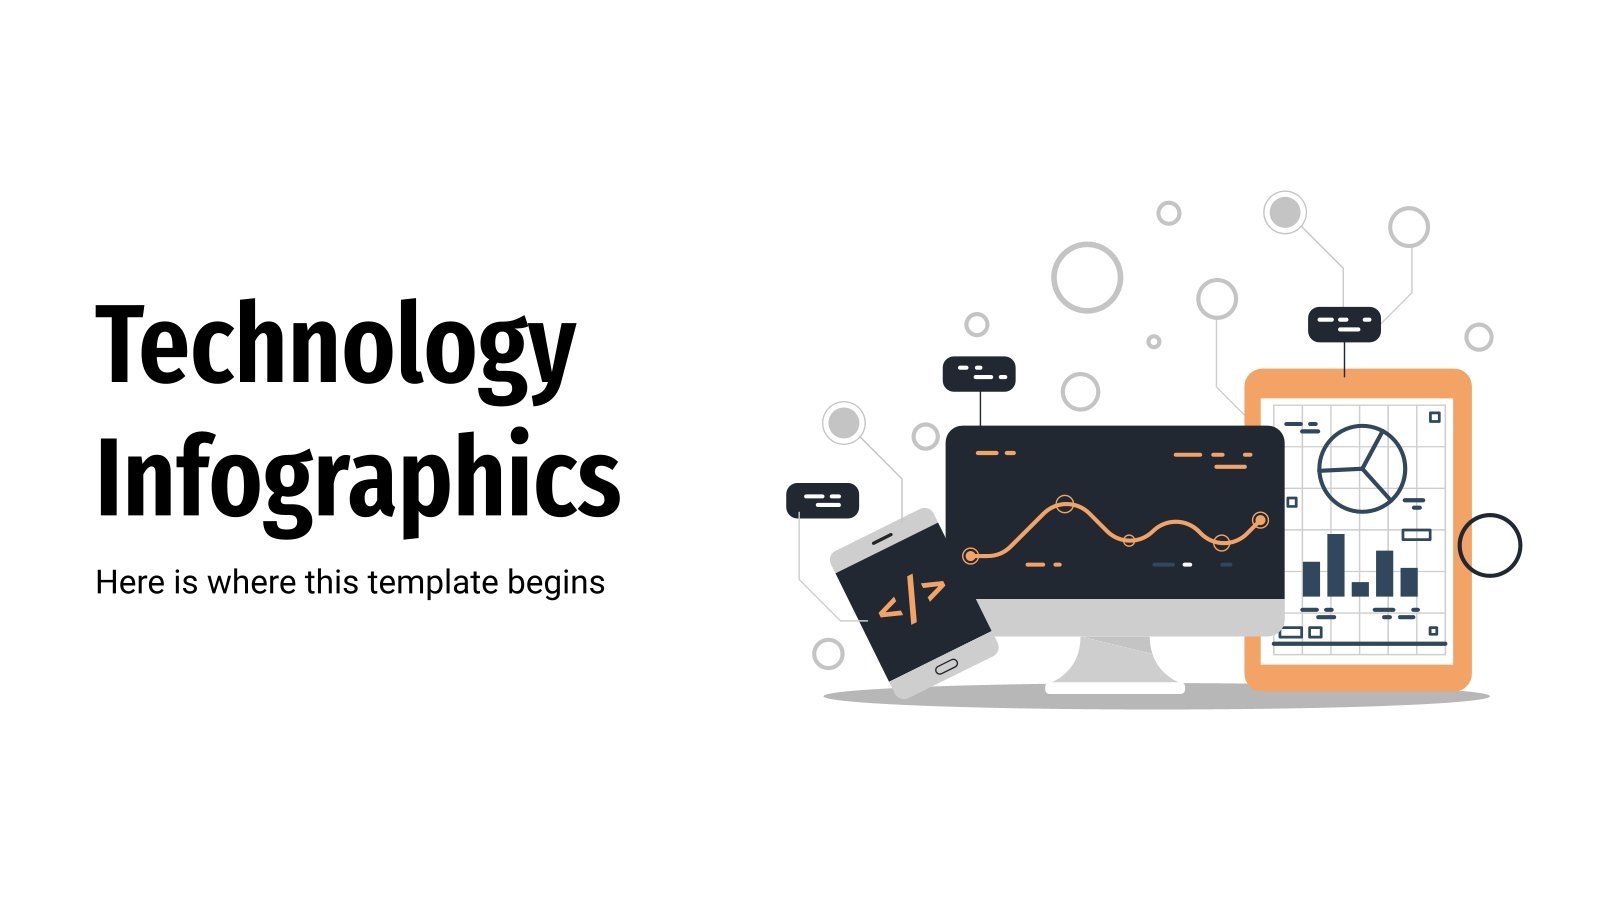
Technology Infographics
The designs included in this new template have something in common: all of them have some kind of technological motif. You’ll find many infographics with devices and icons supporting the circular, isometric, roadmap-like and even hexagonal layouts. and the number of sections range between three and six per slide.
