Process Infographics Presentation templates
Is there a process whose steps you need to talk about in front of an audience? Add these infographics to your slides and let them be a visual support for your lecture.
Filter by
Filters

It seems that you like this template!
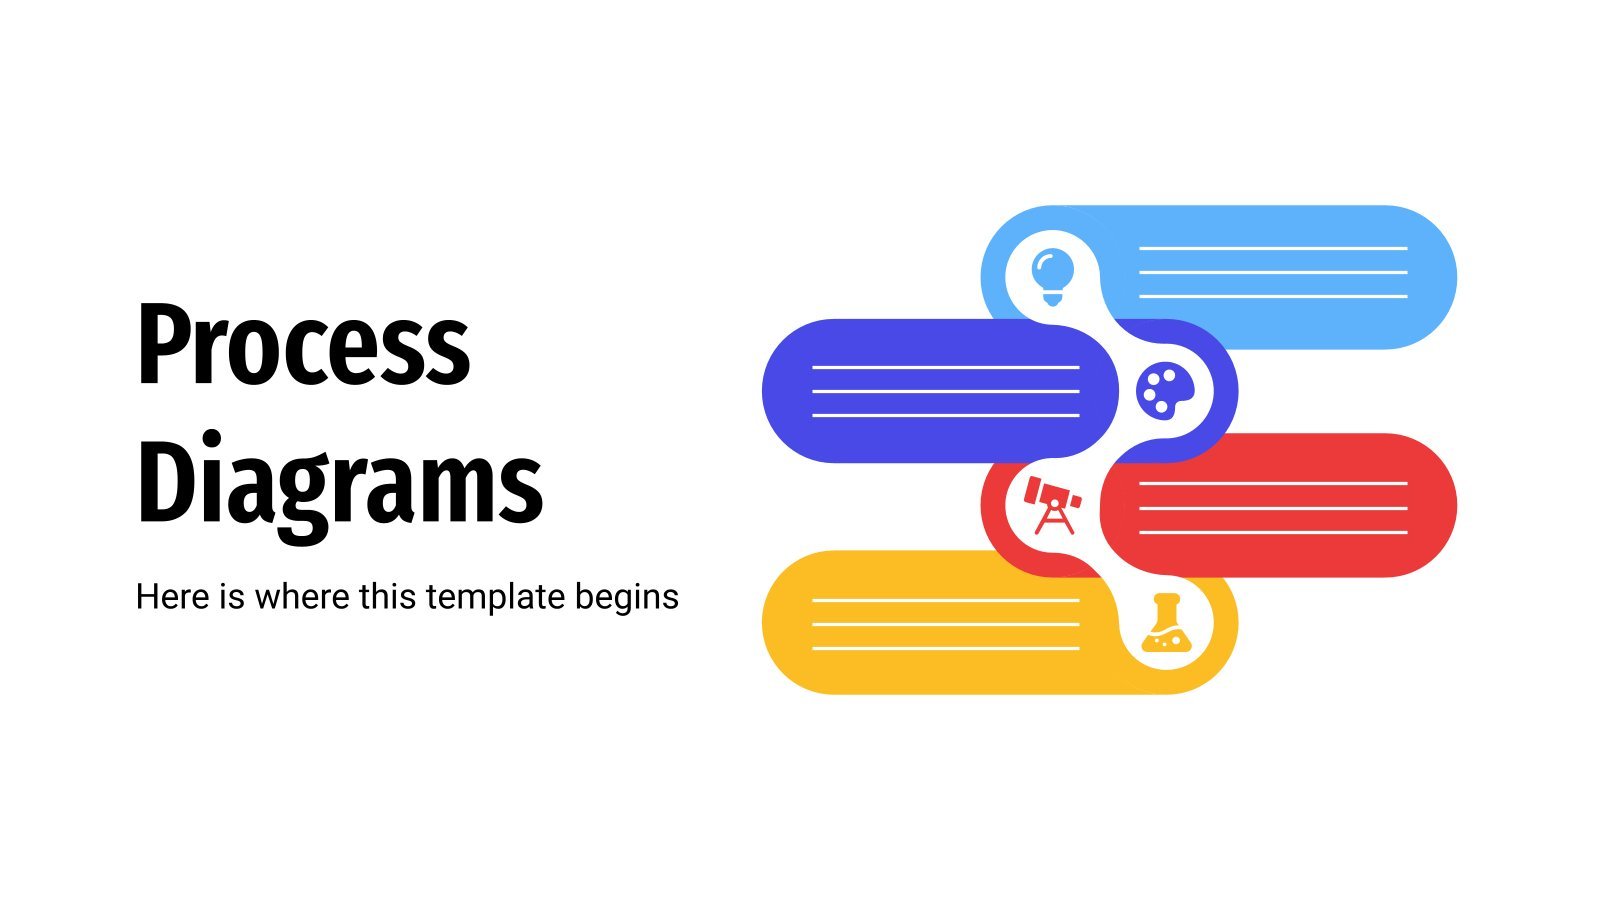
Process Diagrams
If you want to present the progress of your sales, project plan or manufacturing activities, process diagrams will be your best friends. They have the ability to develop a clear description of a process, step by step. They are pretty useful to achieve better communication with other people involved in...
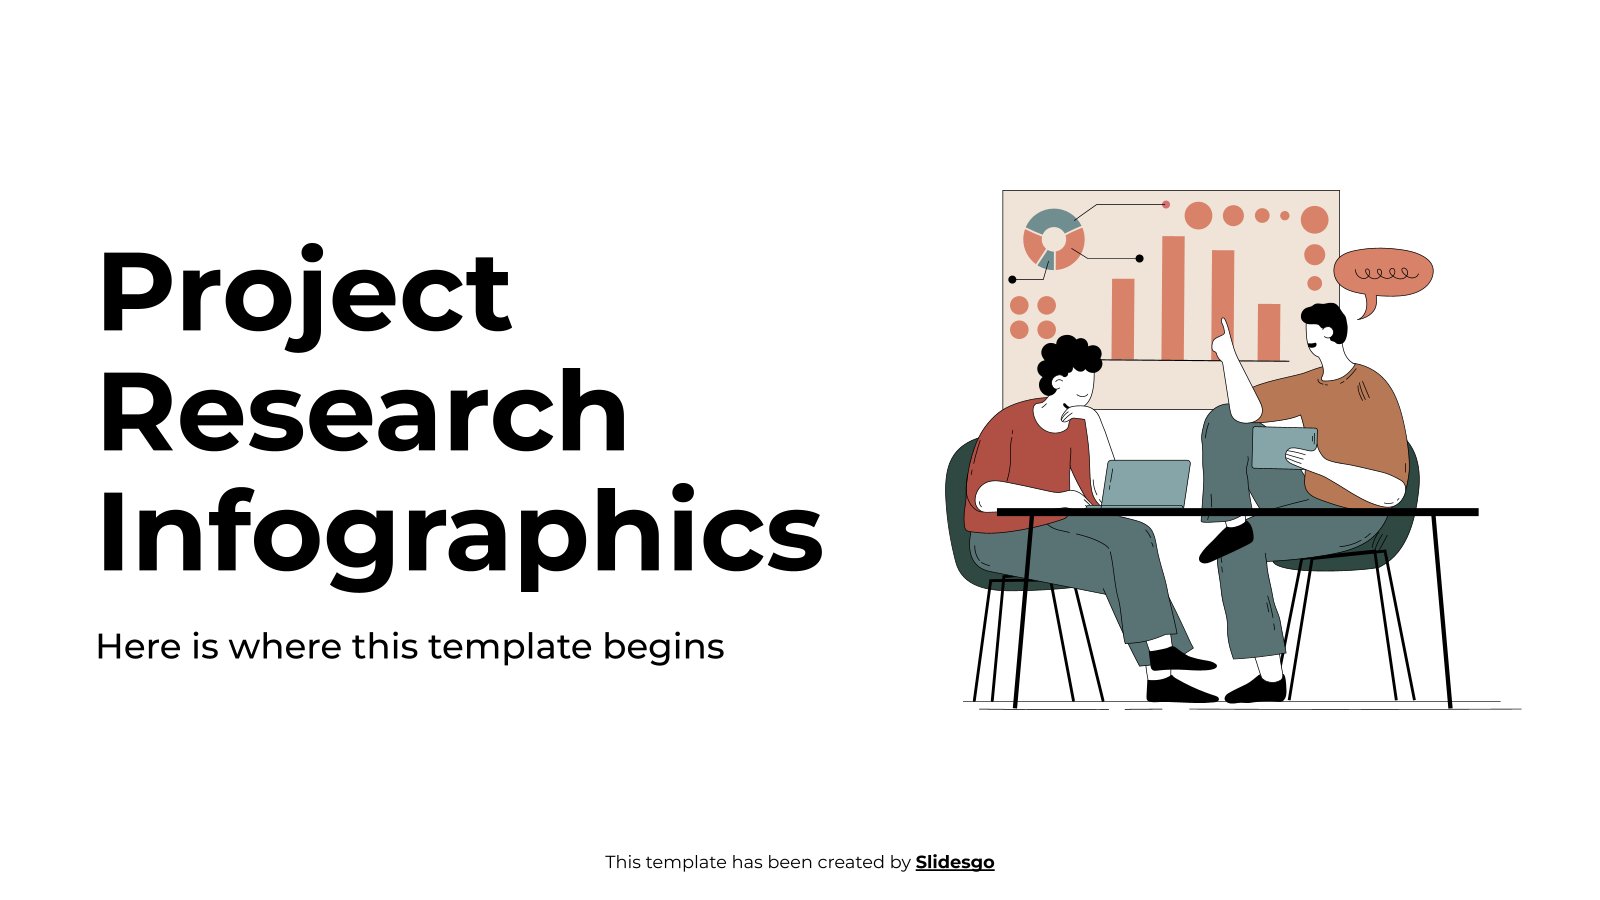
Project Research Infographics
Download the "Project Research Infographics" template for PowerPoint or Google Slides and discover the power of infographics. An infographic resource gives you the ability to showcase your content in a more visual way, which will make it easier for your audience to understand your topic. Slidesgo infographics like this set...
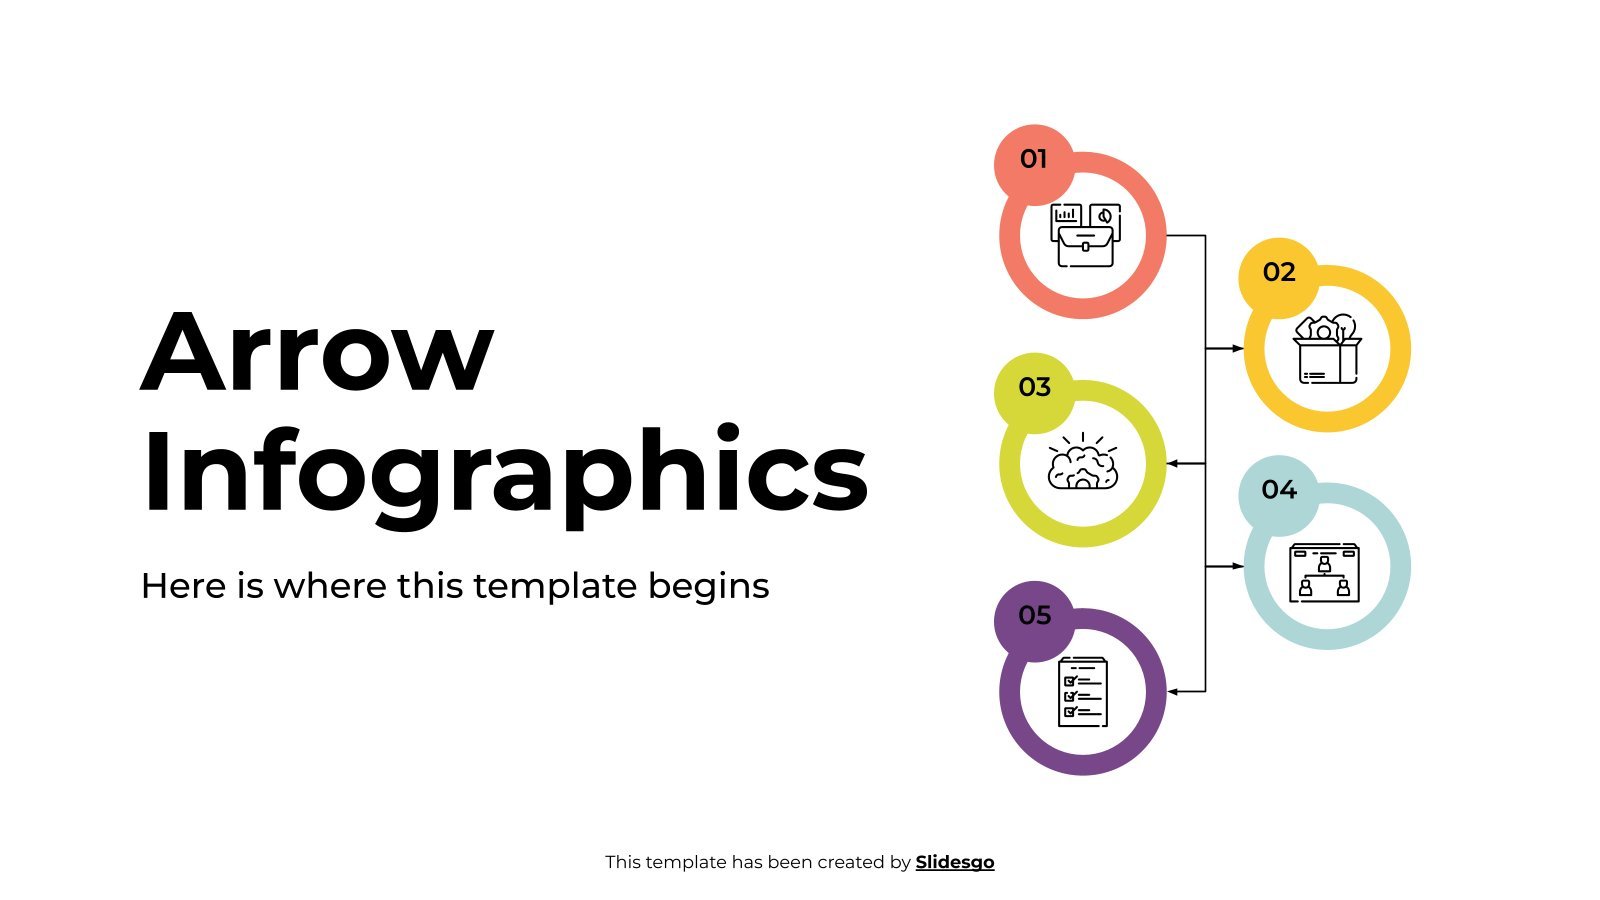
Arrow Infographics
Download the "Arrow Infographics" template for PowerPoint or Google Slides and discover the power of infographics. An infographic resource gives you the ability to showcase your content in a more visual way, which will make it easier for your audience to understand your topic. Slidesgo infographics like this set here...
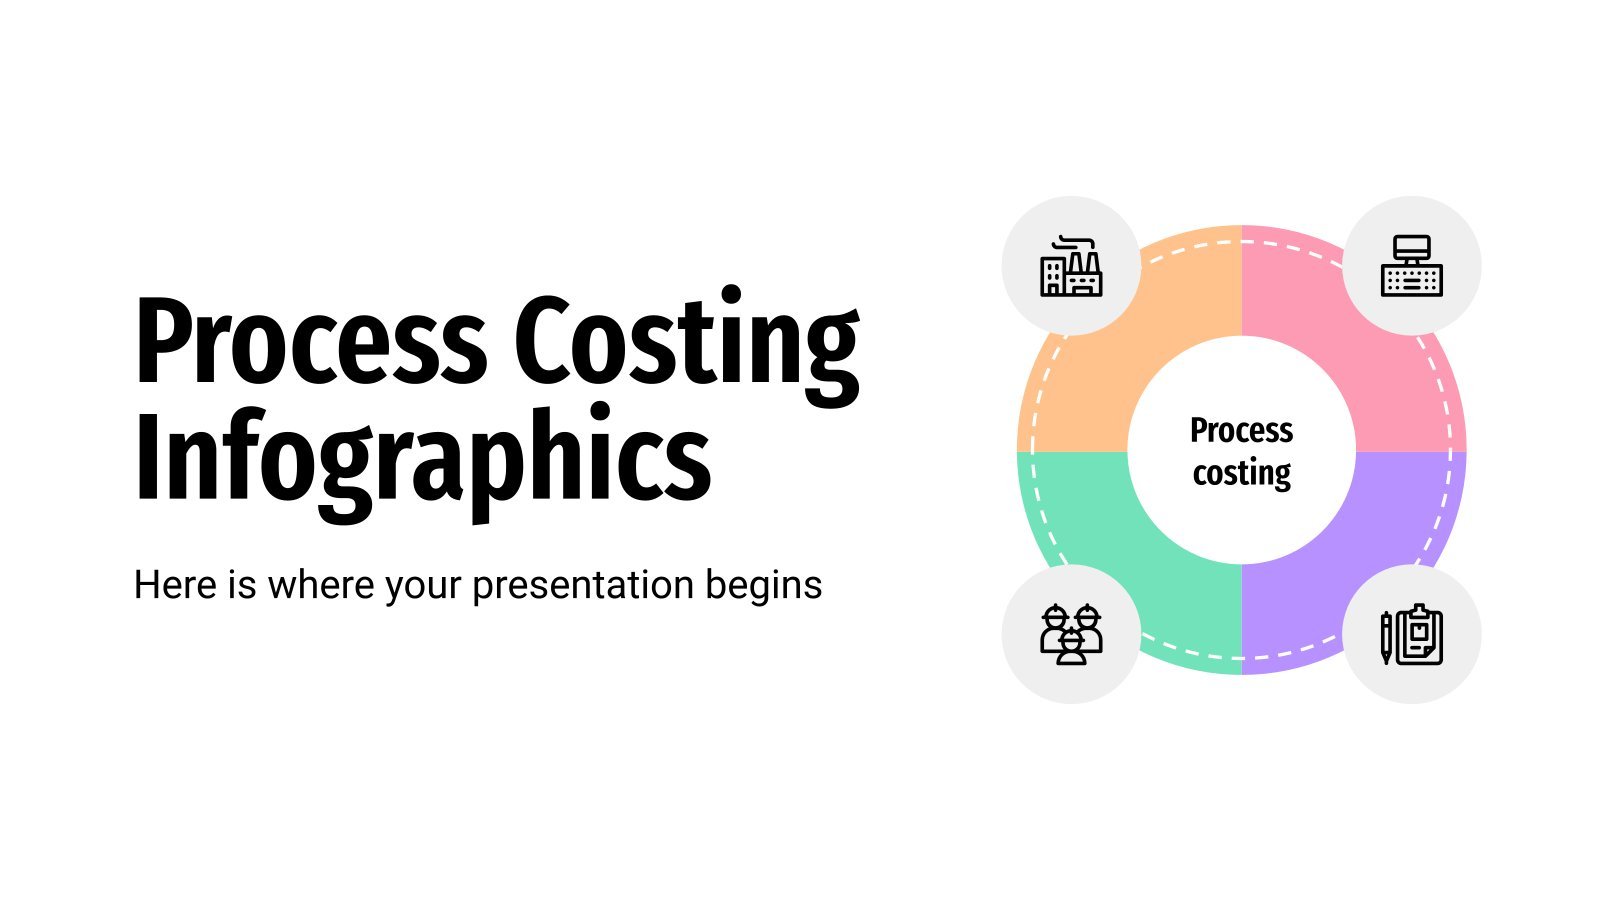
Process Costing Infographics
If you work in the manufacturing industry you surely know what process costing is, a methodology that is usually applied in companies that produce similar units massively. If you are preparing a presentation on this topic, this infographic template will be your best ally, because it contains different graphical representations...
Chemical Reactions Infographics
We can’t wait to see your reaction when you open these infographics! We’re sure between you and Slidesgo there’s a lot of chemistry, specially when we offer you so many editable resources with amazing designs. Take a look at these resources for chemists and make speaking about replacement, decomposition or...
Strategic Alignment Infographics
Strategic alignment in a business is fundamental. It consists, as its name suggests, in aligning the overall objectives of the company with those of each of its departments, so that together they contribute to achieving business success. This infographic template will help you establish those goals and distinguish the different...
Emotions Infographics
Expressing different emotions will be easier than ever thanks to this infographics template with funny emojis that convey different feelings. These funny emoticons have become a universal language, and what better way than through them to talk about feelings. It includes graphs, diagrams, infographics and even process infographics with the...
Engineering Process Infographics
To maximize the results of a company and optimize the time of each procedure, it is necessary to organize the production process or industrial process of a product. There is a science that deals with this, the engineering process, and Slidesgo brings you, for this reason, a set of infographics...
Professional Business Strategy Infographic
Download the "Professional Business Strategy Infographic" template for PowerPoint or Google Slides to get the most out of infographics. Whether you want to organize your business budget in a table or schematically analyze your sales over the past year, this set of infographic resources will be of great help. Start...
Online Shop Guidance Infographics
Download the "Online Shop Guidance Infographics" template for PowerPoint or Google Slides to get the most out of infographics. Whether you want to organize your business budget in a table or schematically analyze your sales over the past year, this set of infographic resources will be of great help. Start...
Project Management Infographics
Download the "Project Management Infographics" template for PowerPoint or Google Slides to get the most out of infographics. Whether you want to organize your business budget in a table or schematically analyze your sales over the past year, this set of infographic resources will be of great help. Start using...
Agile Infographics
Download the "Agile Infographics" template for PowerPoint or Google Slides and discover the power of infographics. An infographic resource gives you the ability to showcase your content in a more visual way, which will make it easier for your audience to understand your topic. Slidesgo infographics like this set here...
Scenario Planning Infographics
This new set of infographics is useful if you want to explain a certain scenario and its different possibilities. Designed with arrows, banners, timelines, tables and other resources, it will help your colleagues decide the best course of action and plan accordingly.
Background Infographics
Download the Background Infographics presentation for PowerPoint or Google Slides. High school students are approaching adulthood, and therefore, this template’s design reflects the mature nature of their education. Customize the well-defined sections, integrate multimedia and interactive elements and allow space for research or group projects—the possibilities of this engaging and...
Business Process Infographics
The following set of infographics has been designed to represent the making of business processes. As such, most of the designs involve different steps or phases, each one with different colors for maximum clarity. Some slides incorporate timelines, others make use of cycle diagrams, others look like tables... There's a...
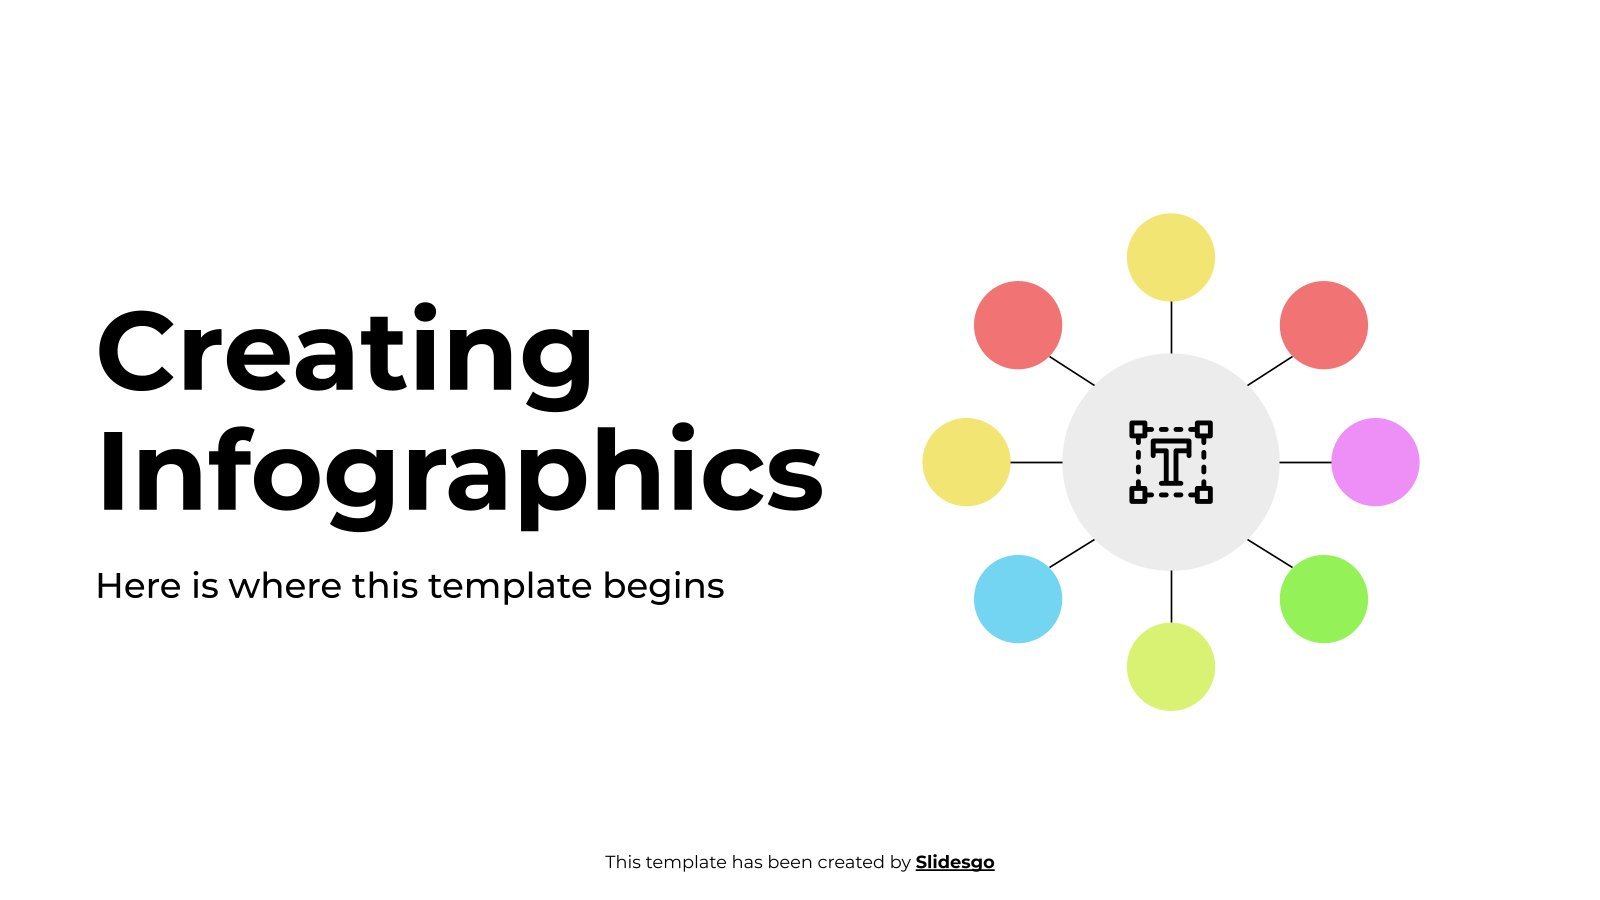
Creating Infographics
Download the "Creating Infographics" template for PowerPoint or Google Slides and discover the power of infographics. An infographic resource gives you the ability to showcase your content in a more visual way, which will make it easier for your audience to understand your topic. Slidesgo infographics like this set here...
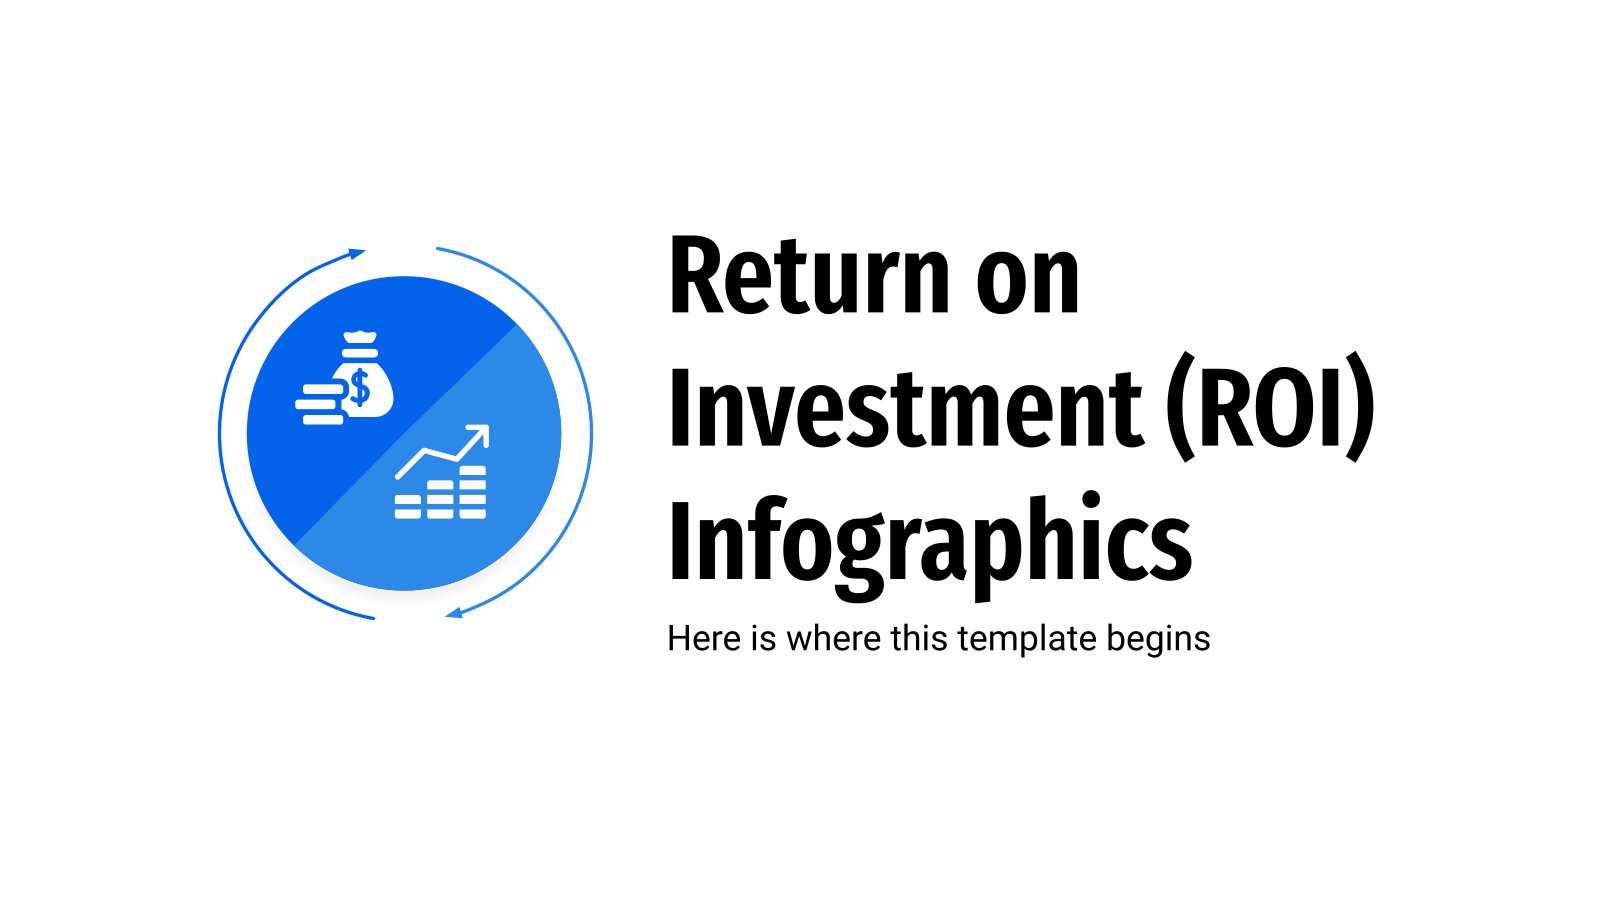
Return on Investment (ROI) Infographics
At Slidesgo, we care that your company's finances go correctly and that you get the most economic benefit from everything you do. For this reason, we bring you some infographics on Return on Investment, also known as ROI. This financial indicator will measure the profitability of your project, action, or...
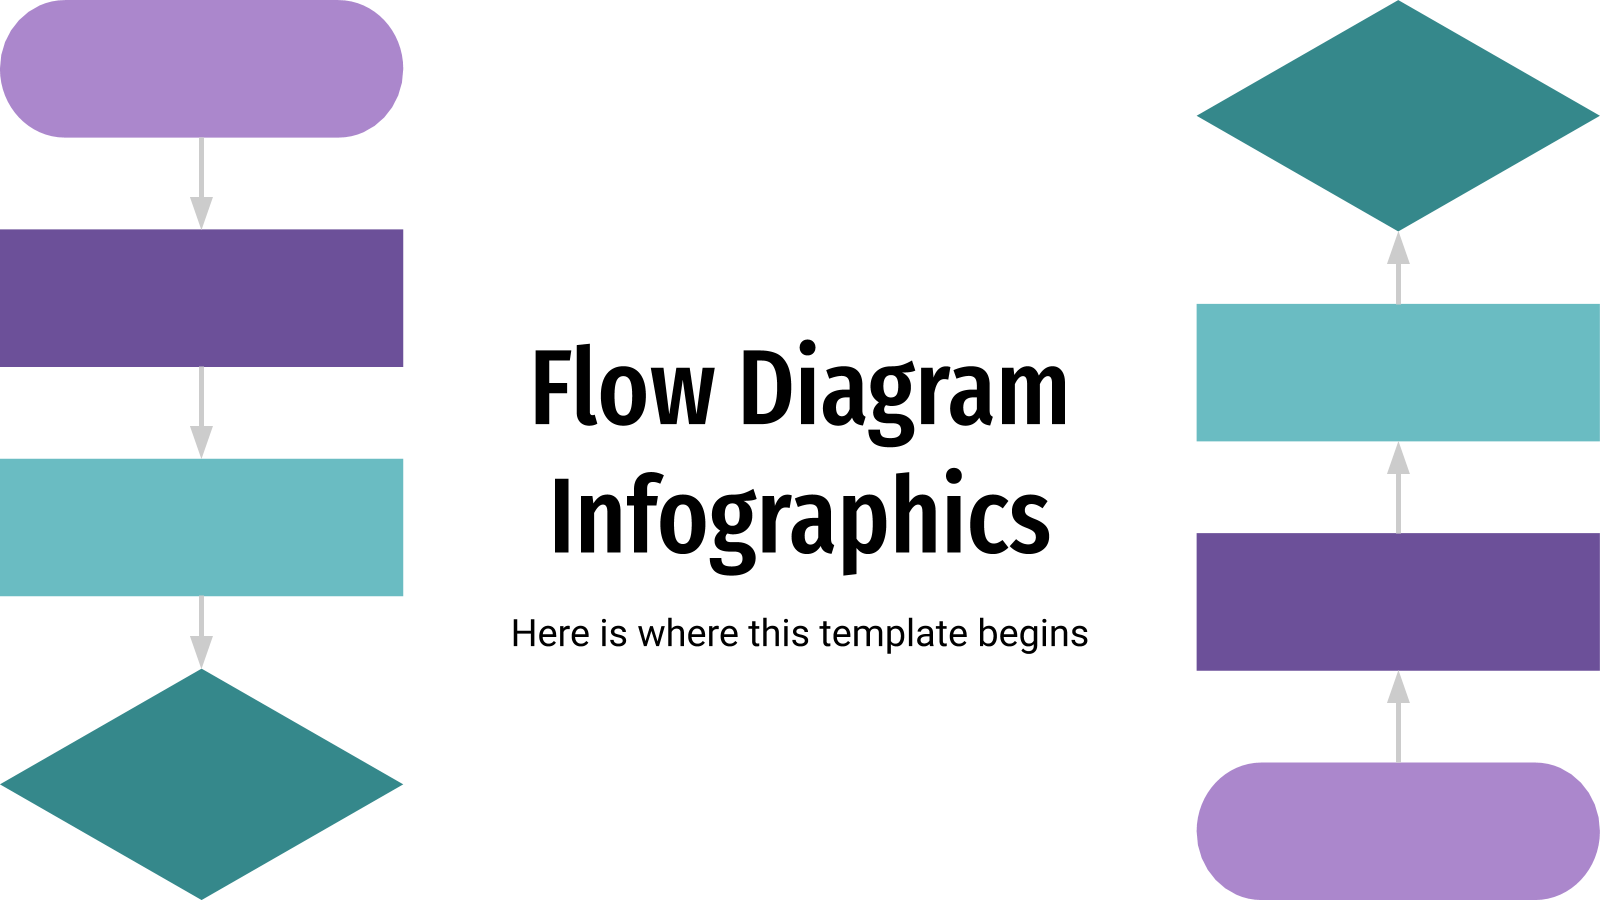
Flow Diagram Infographics
Flow diagrams are used to represent a process or a workflow, along with the possible decisions to take. Download this set of infographics and edit them accordingly. Because making things easier to understand is better than having a hard time trying to explain everything time and time again!

